
 During fermentation, yeast consumes sugar and turns it into alcohol and carbon dioxide. But yeast also produces a range of byproducts that have a huge effect on the flavor of beer. Doing some simple tracking of your homebrew fermentation is one thing you can do to analyze how the beer yeast is performing.
Why Track Your Homebrew Fermentation?
The more information you have, the easier it will be to address potential problems. The more you can learn about managing a fermentation, the better your beer will be!
Fermentation tracking helps you identify potential trouble areas. With just some basic notes on temperature and gravity, you can use this information to evaluate yeast performance. Maybe you’ll discover that fermentation temperature tends to peak on the second or third day. Now you can do something about it.
Towards the end of fermentation, it will be especially important to take gravity readings, as this is the best way to determine when fermentation is complete. Two to three days of consecutive readings indicate that fermentation is done. If you can more accurately predict when fermentation will complete, then you might be able to shave a few days off primary fermentation and have beer ready to drink that much sooner!
Tracking a homebrew fermentation becomes even more important if you are reusing yeast. You may find that when using a fresh yeast pitch, the fermentation goes relatively quickly. But with each successive reuse of yeast, the speed of fermentation may start to lag. When the fermentation deviates from the standard fermentation curve, it may be time for a fresh pitch.
Basic Note-Taking When Tracking a Homebrew Fermentation
To track your homebrew fermentation, take some readings at around the same time each day during fermentation:
- Make note of the fermentation temperature.
- Take a sanitary sample with a thief.
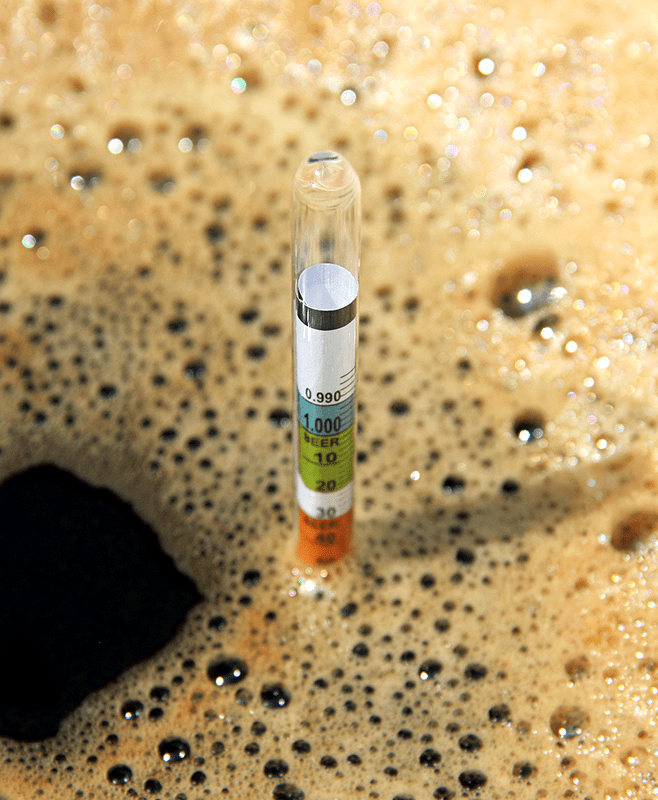
 Take a gravity reading with a hydrometer. You can also use a refractometer. It requires a smaller sample size, but values will need to be adjusted due to the presence of alcohol. There are various tools online that can be used to adjust the reading.
- Optional: take a pH reading (pH should drop during fermentation). You can use a digital pH meter or pH papers to do this.
- Plot the values onto a graph.
- Evaluate the curve.
Gravity values for a normal fermentation should resemble something of an S-curve – a slow decline to start with (day one, lag phase, while yeast are reproducing), followed by a sharper decline for the bulk of fermentation, followed by a slow down as most of the sugars are consumed and the yeast starts to settle out.
Though it’s not imperative that you track your homebrew fermentation, it can be a helpful tool when trying to optimize your procedures. And if you’re a big brewing geek like me, it’s just one more reason to distract yourself from whatever you’re supposed to be doing and do beer stuff instead!
—–
David Ackley is a writer, brewer, and craft beer marketing consultant. He holds a General Certificate in Brewing from the Institute of Brewing and Distilling and is founder of the Local Beer Blog.